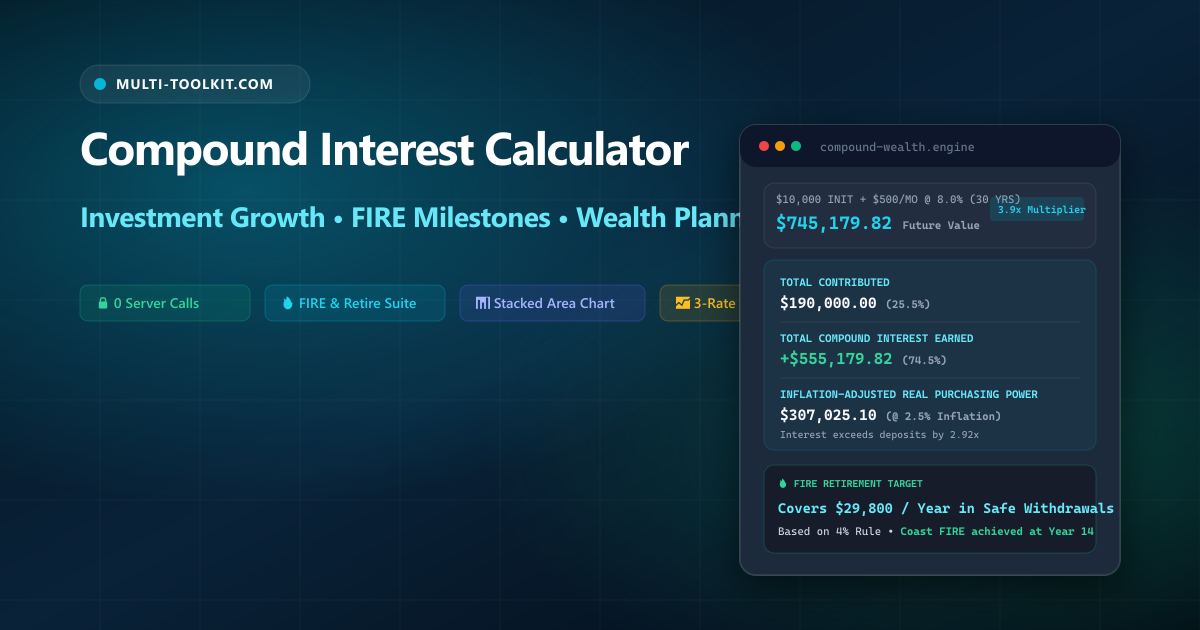
Stop underestimating exponential investment returns: visualize compound growth, model inflation-adjusted wealth, and calculate your target FIRE retirement number 100% inside your browser.
Albert Einstein famously referred to compound interest as the eighth wonder of the world. In the realm of personal investing, long-term index funds, and retirement planning, few mathematical principles are as powerful. A modest monthly investment of \$500 compounded at an 8% annual return over 30 years accumulates to over \$745,000—with over \$555,000 (74.5%) of the final balance consisting of pure compound interest earned on top of \$190,000 in actual out-of-pocket cash contributions.
Yet navigating investment growth projections is often compromised by inadequate online tools: generic calculators that omit compounding frequency options (daily versus monthly versus annual), fail to discount for inflation’s erosion of purchasing power, or gate FIRE retirement target projections behind email capture forms and financial advisor sales funnels.
The Multi-Toolkit Compound Interest Calculator & FIRE Planner delivers complete, unbiased wealth accumulation modeling with 100% client-side privacy.
The wealth-building trap: linear intuition vs exponential reality
1. The snowball phase transition
During the first 7 to 10 years of an investment plan, principal contributions constitute the overwhelming majority of your portfolio. Progress feels slow. Around year 12 to 14, however, your portfolio reaches a critical inflection point where annual compound interest gains surpass your annual cash contributions. In years 20 through 30, wealth accumulation accelerates dramatically.
2. The 10-year procrastination penalty
An investor who contributes \$400/month from age 25 to 35 (\$48,000 total) and then stops contributing entirely will retire at age 65 with \$752,000 (at 8% annual return). Conversely, an investor who waits until age 35 and invests \$400/month continuously for 30 years (\$144,000 total) retires with \$596,000. Starting 10 years earlier yields \$156,000 more wealth despite contributing \$96,000 less capital.
3. Nominal vs real (inflation-adjusted) purchasing power
A projected portfolio of \$1,000,000 in 30 years sounds substantial in nominal terms. However, assuming a historical 2.5% annual inflation rate, \$1,000,000 in 30 years will hold the equivalent purchasing power of roughly \$476,700 in today’s dollars. Wealth planners must always evaluate real purchasing power alongside nominal balances.
4. Personal net worth and financial goal privacy
Entering your personal savings balances, monthly cash flow surplus, and retirement targets into ad-laden web calculators exposes confidential financial profiles to third-party advertising brokers.
In-browser architecture: how Multi-Toolkit calculates compound growth locally
Multi-Toolkit computes all future values, effective annual rates (EAR/APY), inflation deflators, and FIRE numbers directly in client-side JavaScript with zero server requests.
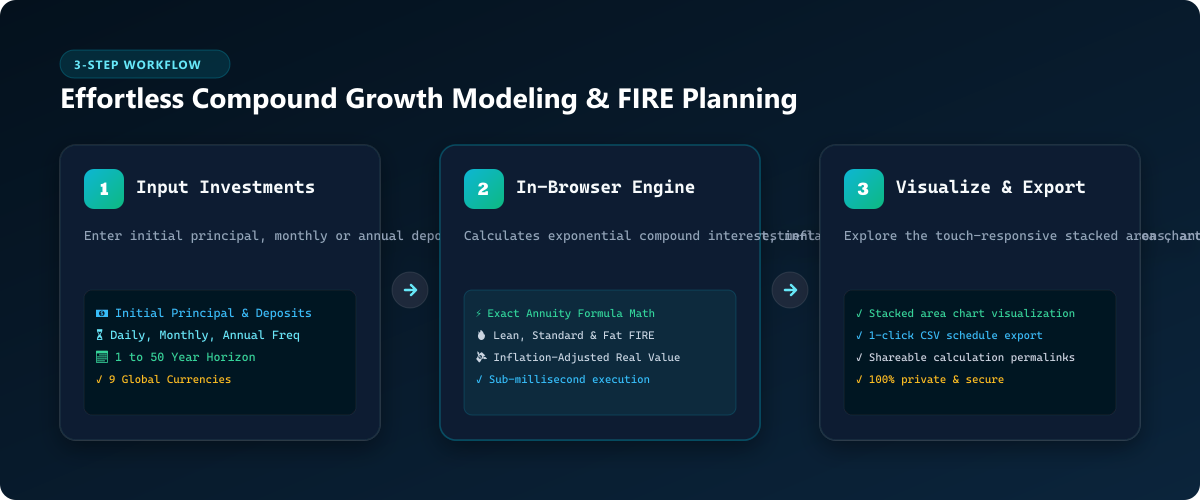
1. Investment Inputs
Enter initial principal, recurring monthly/annual deposits, expected annual return rate, and investment timeline.
2. Compounding Engine
Calculates exact future value across daily, monthly, or annual compounding, discounts for inflation, and maps FIRE numbers in RAM.
3. Charts & Export
Renders interactive stacked area charts, multi-rate comparisons, year-by-year tables, and provides 1-click CSV export.
Core features & capabilities
| Feature | Multi-Toolkit Wealth Studio | Generic Online Calculators | Spreadsheet Templates |
|---|---|---|---|
| Privacy & Data Security | 100% In-Browser (0 Data Sent, No Signup) | Email Capture / Ad Trackers | Local File Only |
| Compounding Intervals | Daily, Monthly, Quarterly, Annual | Annual Only | Requires Complex Formulas |
| Interactive Visualization | Touch-Enabled Stacked Area Chart | Static Text / Simple Bar | Manual Chart Formatting |
| Inflation Discounting | Real Purchasing Power Deflator | Unsupported | Requires Custom Column |
| FIRE Retirement Suite | Lean, Standard, Fat & Coast FIRE | Unsupported | Requires Complex Setup |
| Multi-Rate Scenarios | Compare 3 Rates Simultaneously | Single Calculation Only | Duplicate Tabs Required |
| Schedule Export | 1-Click CSV Download | Unsupported | Native |
Step-by-step interactive guide
- Enter Initial Principal & Contribution: Open the Compound Interest Calculator. Input your starting investment amount, periodic monthly or annual contribution, expected annual return rate, and investment timeline.
- Select Compounding Frequency & Inflation: Choose your compounding frequency (Monthly for mutual funds/SIPs, Daily for high-yield savings) and toggle the inflation discount slider to view both nominal and real purchasing power.
- Review Interactive Visualizations: Inspect the touch-responsive Stacked Area Chart to observe how the green compound interest curve overtakes the blue principal contribution line.
- Explore FIRE Milestones & Export CSV: Switch to the FIRE Calculator tab to view your Coast FIRE age and Financial Independence target numbers based on the 4% safe withdrawal rule. Click “Download CSV” to export the year-by-year growth table.
Visual interface showcase: light & dark modes
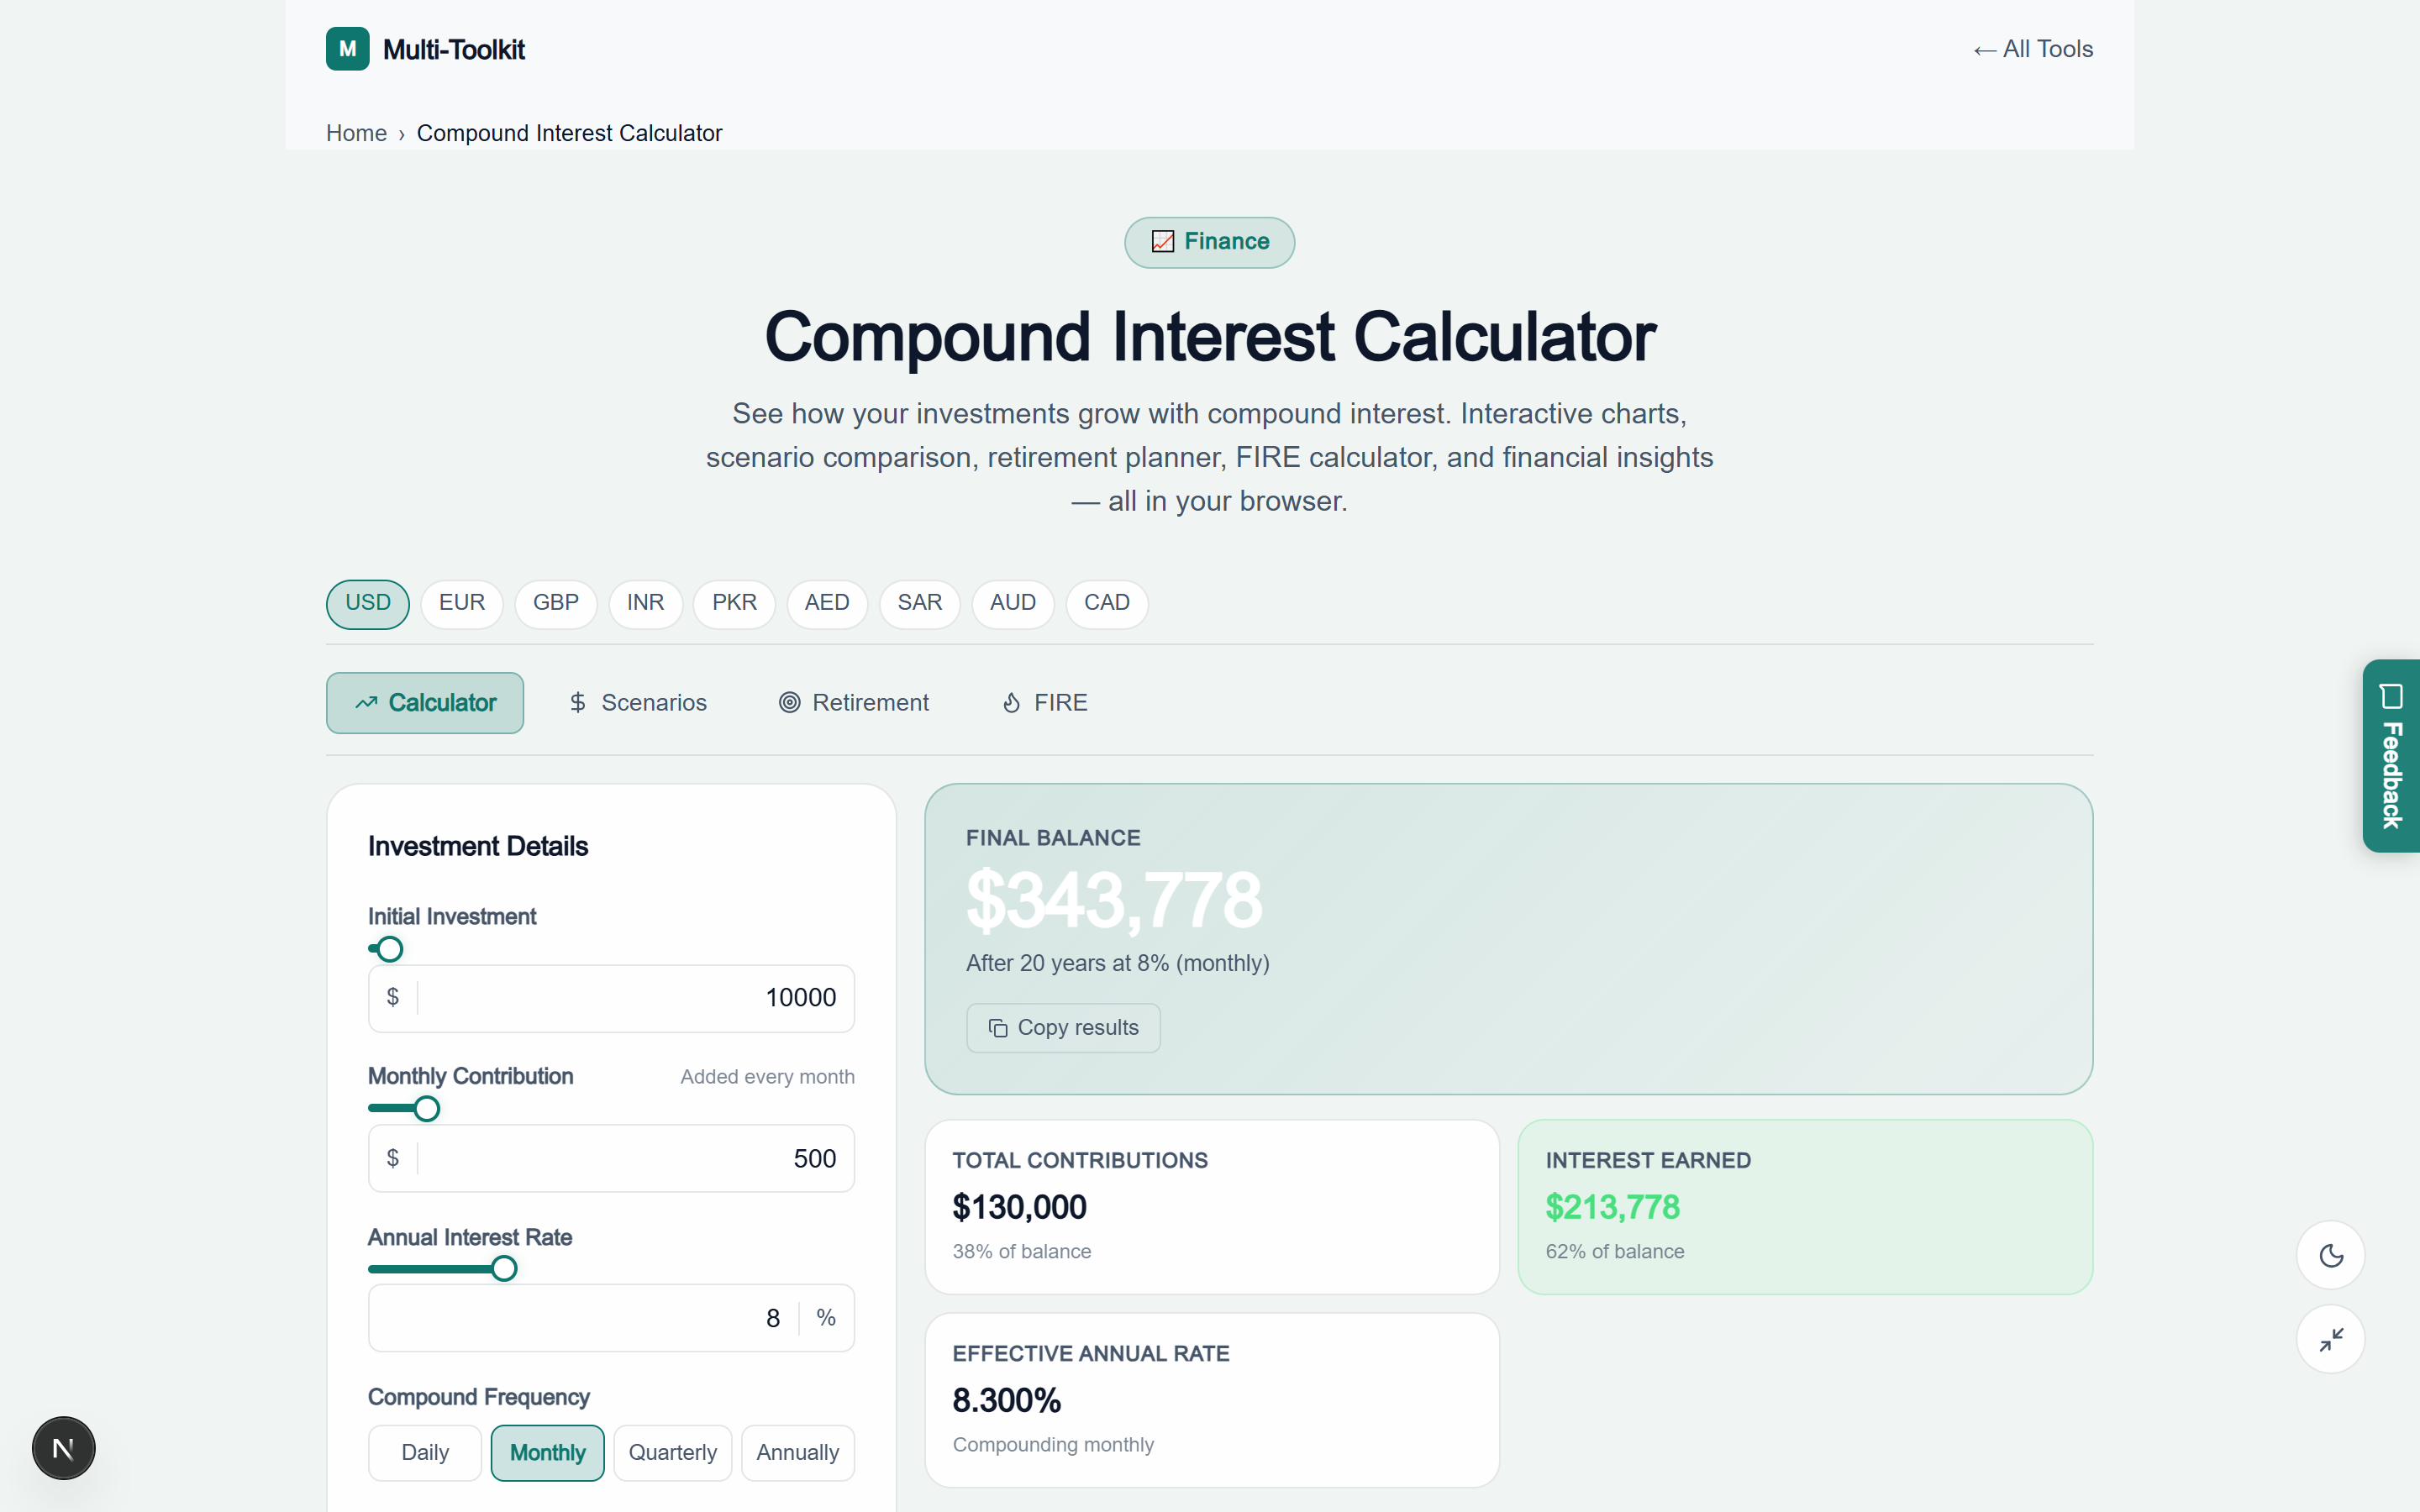
Light Mode Interface
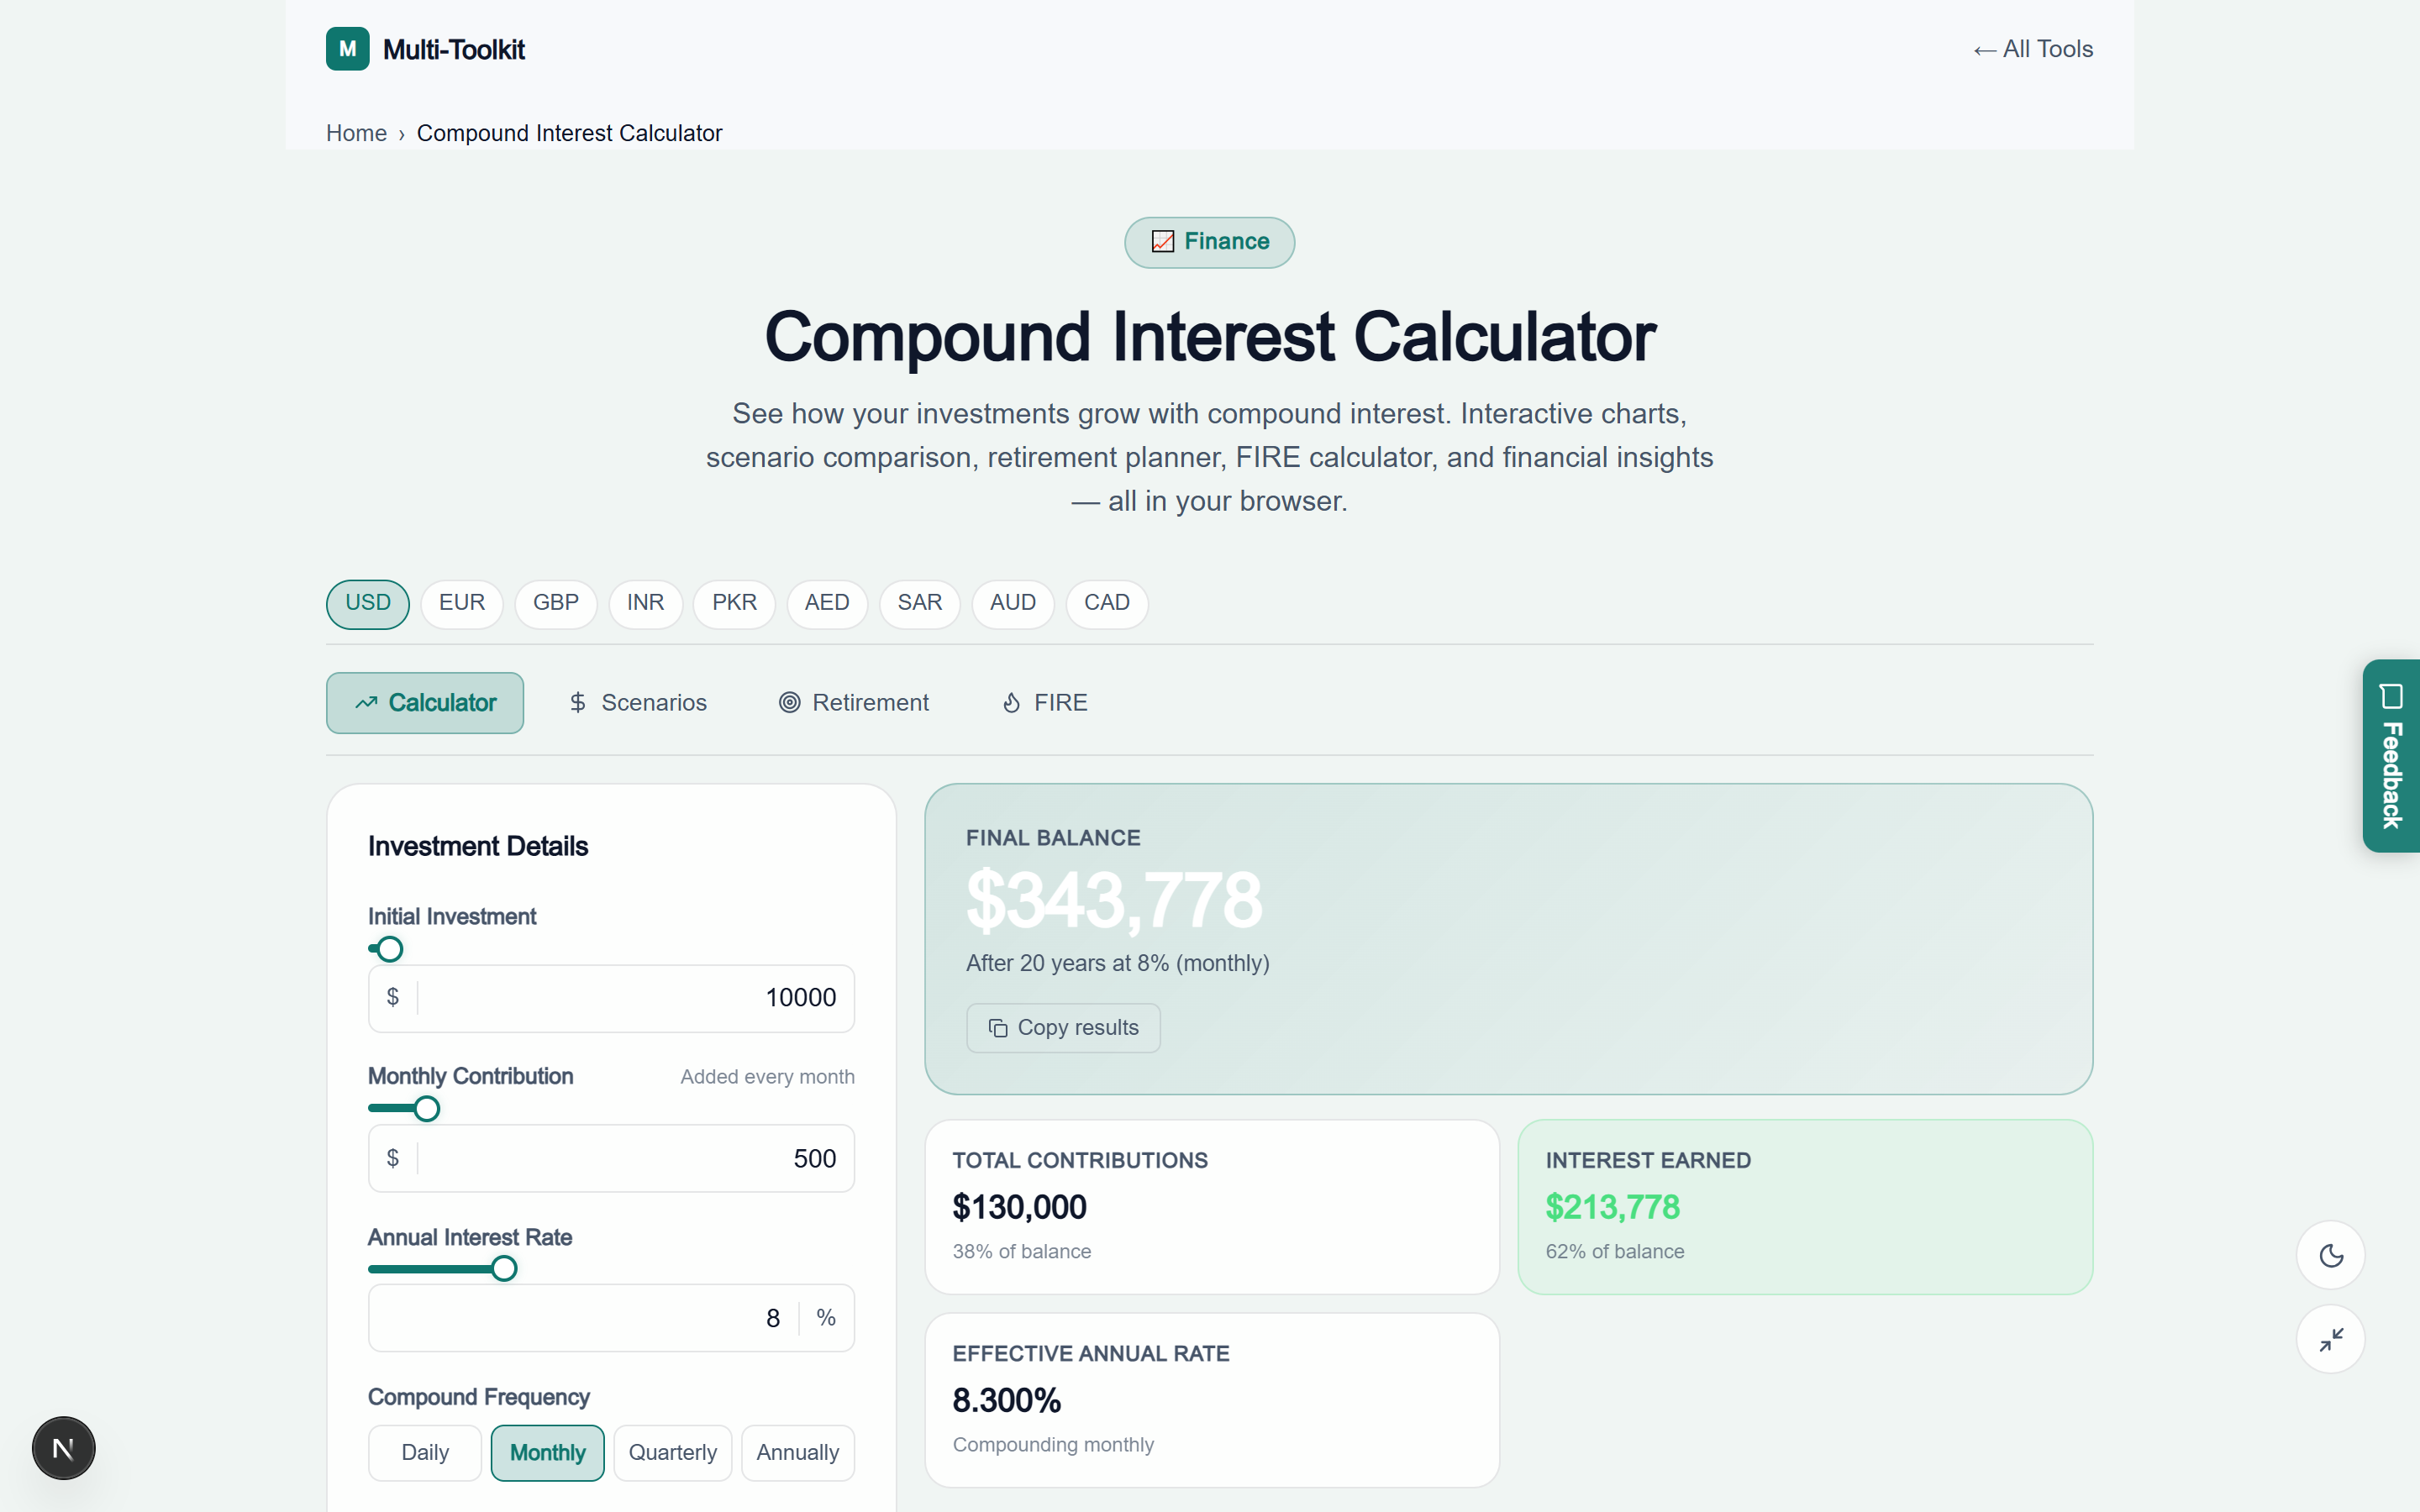
Dark Mode Interface
Five critical investment pitfalls to avoid
Pitfall 1: Ignoring the long-term impact of inflation
A nominal future portfolio of \$1,000,000 in 30 years will not buy what \$1,000,000 buys today. Always use the Inflation Adjustment toggle to verify your real purchasing power in today’s currency.
Pitfall 2: Confusing APR with APY / Effective Annual Rate
When evaluating savings instruments, bonds, or dividend reinvestment plans, always evaluate the APY (Annual Percentage Yield) rather than nominal APR, especially when compounding occurs daily or monthly.
Pitfall 3: Cashing out dividends instead of reinvesting
Compounding relies on reinvesting all dividend distributions. Taking cash dividend payouts disrupts the exponential curve, reducing 30-year terminal wealth by up to 40%.
Pitfall 4: Attempting to time the market vs maximizing “time in the market”
Trying to predict short-term stock market pullbacks often results in missing the market’s strongest growth days. Establishing an automated monthly Systematic Investment Plan (SIP) captures dollar-cost averaging and maximizes compounding duration.
Pitfall 5: Underestimating investment expense ratios and fees
A seemingly minor 1.5% management fee charged by an actively managed fund can consume over 35% of your total potential lifetime returns compared to an ultra-low-cost index ETF charging 0.04%.
Monthly investment growth reference matrix (at 8.0% annual return)
| Monthly Contribution | 10 Years | 20 Years | 30 Years | 40 Years |
|---|---|---|---|---|
| \$250 / month | \$46,187 | \$147,760 | \$372,590 | \$877,654 |
| \$500 / month | \$92,375 | \$295,519 | \$745,180 | \$1,755,308 |
| \$1,000 / month | \$184,750 | \$591,038 | \$1,490,360 | \$3,510,616 |
| \$2,000 / month | \$369,500 | \$1,182,076 | \$2,980,719 | \$7,021,232 |
Security & privacy architecture
Your wealth goals and financial figures should remain completely confidential:
- No Account or Email Required: You never need to submit personal financial information or register.
- 100% Client-Side Calculations: All future values, inflation deflators, and CSV exports execute exclusively in your browser memory. No data is sent to our servers.
- Progressive Web App (PWA): Fully cached service workers allow you to project financial models during flights or offline sessions.
Frequently asked questions
What is compound interest and how does it work?
Compound interest is interest earned on both the initial principal and previously accumulated interest. Over long horizons, it produces exponential wealth growth as reinvested returns continuously generate their own subsequent returns.
What is the compound interest formula with monthly contributions?
The future value formula is: A = P × (1 + r/n)^(nt) + PMT × [((1 + r/n)^(nt) - 1) / (r/n)], where P is principal, r is annual interest rate (decimal), n is compounding frequency (12 for monthly), t is years, and PMT is periodic contribution.
How does inflation affect my projected investment returns?
Inflation decreases the future purchasing power of money. Multi-Toolkit includes an inflation adjustment feature that calculates the real purchasing power of your future portfolio in today's dollars alongside the nominal balance.
What is the FIRE number and the 4% safe withdrawal rule?
The FIRE (Financial Independence, Retire Early) number is the portfolio size needed to retire indefinitely. Based on the 4% safe withdrawal rule, your target FIRE portfolio equals your estimated annual living expenses multiplied by 25 (Annual Expenses × 25).
What is Coast FIRE?
Coast FIRE is the milestone where your current invested portfolio is large enough that it will compound to your ultimate retirement goal on its own by retirement age, without requiring any additional future savings.
Are my financial figures or net worth details stored on any server?
No. All calculations, graphs, and export tables are computed 100% locally inside your web browser memory. No financial data is ever transmitted across the network.
Explore related financial & productivity tools
Complement your financial planning with these free utilities on Multi-Toolkit:
- EMI & Loan Calculator — Calculate monthly loan payments, amortization schedules, and prepayment savings.
- Salary & Net Pay Calculator — Model international and GCC gross-to-net take-home pay and allowances.
- Percentage Calculator — Compute percentage increases, growth margins, and return ratios.
- Discount & Margin Calculator — Calculate markdowns, profit margins, and tax inclusive rates.
- VAT & Sales Tax Calculator — Compute standard, reverse, and inclusive/exclusive value-added tax.
Calculate compound growth, model inflation-adjusted wealth, and plan your FIRE retirement—100% in your browser with complete privacy:
Open Free Compound Interest Calculator →